This article is based on my Linux Performance Monitoring and Tuning course on Pluralsight which, by coincidence, was released just before news of Spectre and Meltdown broke.
By now the critical stage of the Spectre and Meltdown vulnerabilities is largely over. Patches for affected operating systems have been written and, assuming you keep your servers properly updated, you should be safe.
That’s the easy part. The real problem is that the patch might slow your system down — particularly if you’re running applications that interact often with the kernel. So you’ll want to know just how much of a hit you’ve taken, and what upgrades you’ll need to get you back to where you should be.
My recent Pluralsight course discussed understanding, diagnosing, tuning, and monitoring performance on Linux servers. Those are the tools of choice for the kind of assessment and administration this problem demands, so I thought I’d make this guide to installing and using the collectd daemon to gather and monitor performance metrics locally or across a network.
Besides collectd, the course also covers the Nagios, Munin, and nmon monitoring tools, along with analysing metrics and optimising existing stacks.
Ideally, you would have some older, pre-Spectre, performance data available to use as a baseline. But even if you have to start from scratch, it won’t take too long for collectd to start pointing fingers at your pain points.
Installing collectd
collectd is a Linux system daemon that collects and organizes system performance data into Round Robin Database (RRD) files normally kept in the /var/lib/collectd/rrd/ directory tree.
I’m going to take you through the process of installing and configuring collectd. I’ll then demo a tool called collectd-web that will convert the RRD data into graphs. Once that’s all done, I’ll show you how to set up a couple of remote servers as collectd clients so we can access data from the entire fleet on a single server. But one thing at a time.
Installing collectd as a standalone is simple: you need nothing more than the collectd package. Getting the collectd-web tool installed and running, on the other hand, can be a bit of a trick. Since clients require nothing more than collectd, I’ll focus on setting up the machine our collectd server. I’m going to be doing this on an LXC container running Ubuntu 16.04.
Here’s the package list.
# apt install -y collectd python build-essential \
 librrds-perl librrds-perl libjson-perl libhtml-parser-perl \
 apache2
Let me break that down for you. We’ll need Python to run the collectd-web tool and build-essential to build the source code we’ll get later. Those Perl libraries are to interpret the RRD database files and to add JSON and CGI functionality. Finally, we’ll be using Apache as our web server to handle the web requests themselves. I’ll let all that happen by itself and skip the boring details.
Next I’ll use a2enmod to enable the CGI modules that’ll allow Apache to manage some of the visualizations.
# a2enmod cgi cgid
cpan will install a couple of Perl modules. Make sure you use uppercase for JSON and CGI.
# cpan JSON
# cpan CGI
I’m going to use a text editor to add a section to the 000-default.conf file in the /etc/apache2/sites-available/ directory that will enable Apache CGI script handling from the web server end.
<Directory /var/www/html/collectd-web/cgi-bin>
Options Indexes ExecCGI
AllowOverride All
AddHandler cgi-script .cgi
Require all granted
</Directory>
With that done, there’ll be only one more thing to do get Apache just the way we want it. Take a look at the apache2.conf configuration file and scroll down to the Include line where we set the network ports on which to listen. Note how it’s all offloaded to a file called ports.conf.
# Include list of ports to listen on
Include ports.conf
If we want to be able to access our data remotely through a browser, that’s the file we want to edit. I’ll just make sure the “Listen” line in ports.conf reads 0.0.0.0:80, so that we’re not restricted to only local guests.
Listen 0.0.0.0:80
With all our Apache work done, now’s the time to restart it so everything is properly updated.
# systemctl restart apache2
Now we should take a quick look at the collectd.conf configuration file in the /etc/collectd/ directory. It’s a big file and most of the default settings will work for us right now, but you should be aware of the kinds of things you can add and how they’re configured. Most of collectd’s power is delivered through its plugins, which you load (by uncommenting) in the LoadPlugin section. Some of the plugins might already be loaded, like apache and cpu near the top.
LoadPlugin apache
#LoadPlugin apcups
#LoadPlugin ascent
[…]
LoadPlugin cpu
This means that, when properly configured below, collectd will monitor and report Apache and CPU behavior.
You’ll also need to configure each of your plugins below in the configuration section. The cpu configuration is commented out, but it will work fine with its default values. In this case, the configuration section is only for people who might want to customize it.
#<Plugin cpu>
# ReportByCpu true
# ReportByState true
# ValuesPercentage false
#</Plugin>
If you do edit the config file, be sure to restart the daemon using systemctl. This is also a good place to look for error messages in case something went wrong. Pay close attention to any error messages you get — especially through the system logs — and carefully check the syntax you used in the configuration file. It’s also possible that you’re missing a Perl module or two.
# systemctl restart collectd
# systemctl status collectd
But before all this will be useful, we’ll need to install the collectd-web tool itself. I’ll first install git, and then clone the collectd-web repository. This will save the source code to a new directory called collectd-web.
# apt install git
$ git clone https://github.com/httpdss/collectd-web.git
There’s a script in the cgi-bin subdirectory that we’ll have to make executable, so I’ll change to cgi-bin and use chmod to add an executable bit to graphdefs.cgi. Then I’ll head back one level to the collectd-web directory so I can make one edit to the Python runserver script.
$ cd collectd-web/cgi-bin
$ chmod +x graphdefs.cgi
$ cd ..
$ nano runserver.py
I’m going to change the two places where the localhost is referenced by 127.0.0.1, and open them up to the entire internet by editing them to read 0.0.0.0. This will allow collectd to listen for data from other machines.
With that, we’re all set. Make sure you’re in the collectd-web directory, and run the runserver.py script. I’ll add the ampersand character so it’ll run in the background and I’ll get my command line back. It’s a good idea to keep an eye on this shell, however, since events are printed here that can sometimes be useful.
$ ./runserver.py &
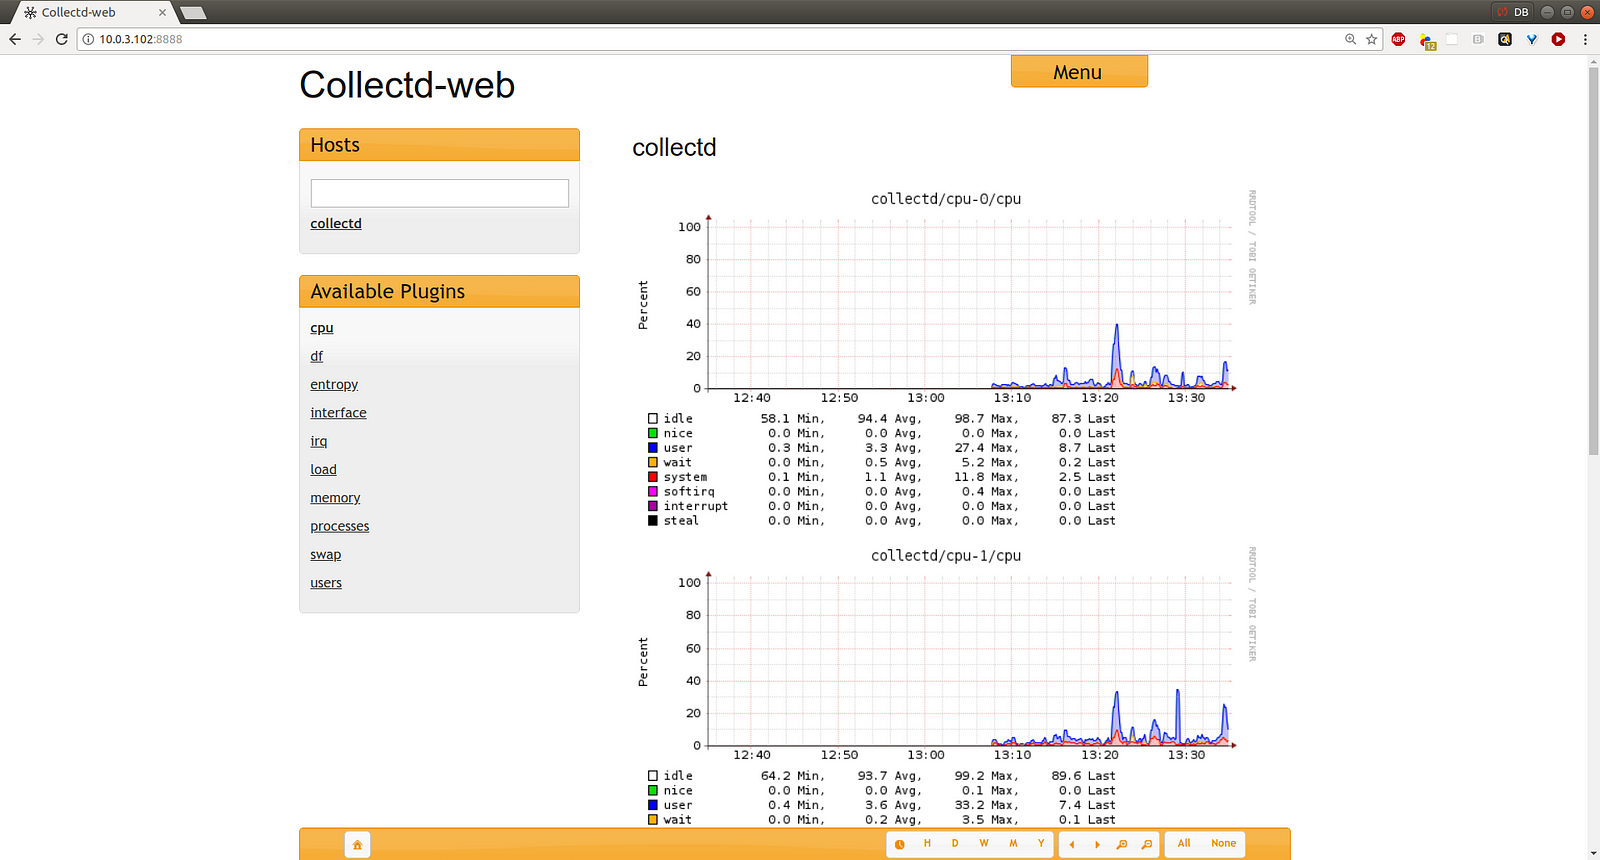
Now I’ll fire up a browser and point it to the LXC container’s IP address, specifying the port 8888. Speaking of network ports, if you’re running a firewall, you’ll need to open up ports 8888 and 25826. You can click on the name of your host and then select from the metrics displayed below.
A multi-host collectd configuration
If you’ve been following along with the demo so far you’ve got metrics from a single server being displayed through a local web service. But if you’ve got lots of servers, you probably won’t enjoy opening a new browser tab for each one — especially not if you’re expected to cycle through them periodically through your work day.
So why not send the data to a single server? Let’s do that. I’ve launched two servers and installed nothing more than the collectd package on each. Their hostnames are collectd-client1 and collectd-client2 — which will make it easier to identify them later.
I’m logged into one of my clients and I’m going to edit the collectd.conf configuration file. At the very least I’ll need to make sure the network plugin is enabled and then head down to the configuration to set things up. All I need to do there is uncomment the open and close Plugin network lines, the open and close Server lines, and then edit the Server IP address to match IP used by my Collectd server. This is so the client can push data to the server. I’ll leave the other lines at their default values.
LoadPlugin network
<Plugin network>
# # client setup:
# Server “ff18::efc0:4a42” “25826”
 <Server “10.0.3.102” “25826”>
# SecurityLevel Encrypt
# Username “user”
# Password “secret”
# Interface “eth0”
# ResolveInterval 14400
 </Server>
# TimeToLive 128
#
# # server setup:
# Listen “ff18::efc0:4a42” “25826”
# <Listen “239.192.74.66” “25826”>
# SecurityLevel Sign
# AuthFile “/etc/collectd/passwd”
# Interface “eth0”
# </Listen>
# MaxPacketSize 1452
#
# # proxy setup (client and server as above):
# Forward true
#
# # statistics about the network plugin itself
# ReportStats false
#
# # “garbage collection”
# CacheFlush 1800
</Plugin>
That’s it. You’ll restart the collectd service and then repeat the process on any other clients you want to monitor.
# systemctl restart collectd
Now, back on the server, I’ll edit the same configuration file, and make sure that networking is enabled. Again, as before, I’ll scroll down to the networking configuration section and uncomment the Plugin lines, but this time, I’ll uncomment and edit the Server Setup section rather than the Client section. Here, I’ll change the Listen line to 0.0.0.0 so the server will listen for incoming data from anywhere.
# server setup:
# Listen “ff18::efc0:4a42” “25826”
 <Listen “0.0.0.0” “25826”>
# SecurityLevel Sign
# AuthFile “/etc/collectd/passwd”
# Interface “eth0”
 </Listen>
I’ll save and close the file and restart both the collectd and apache services.
# systemctl restart collectd
Then, making sure that the Python runserver script isn’t already running — if it is you should shut it down using kill — start it up again.
$ ./runserver.py &
Now head back to the browser and refresh the page. Links for each of your clients should immediately appear, allowing us to choose between views.
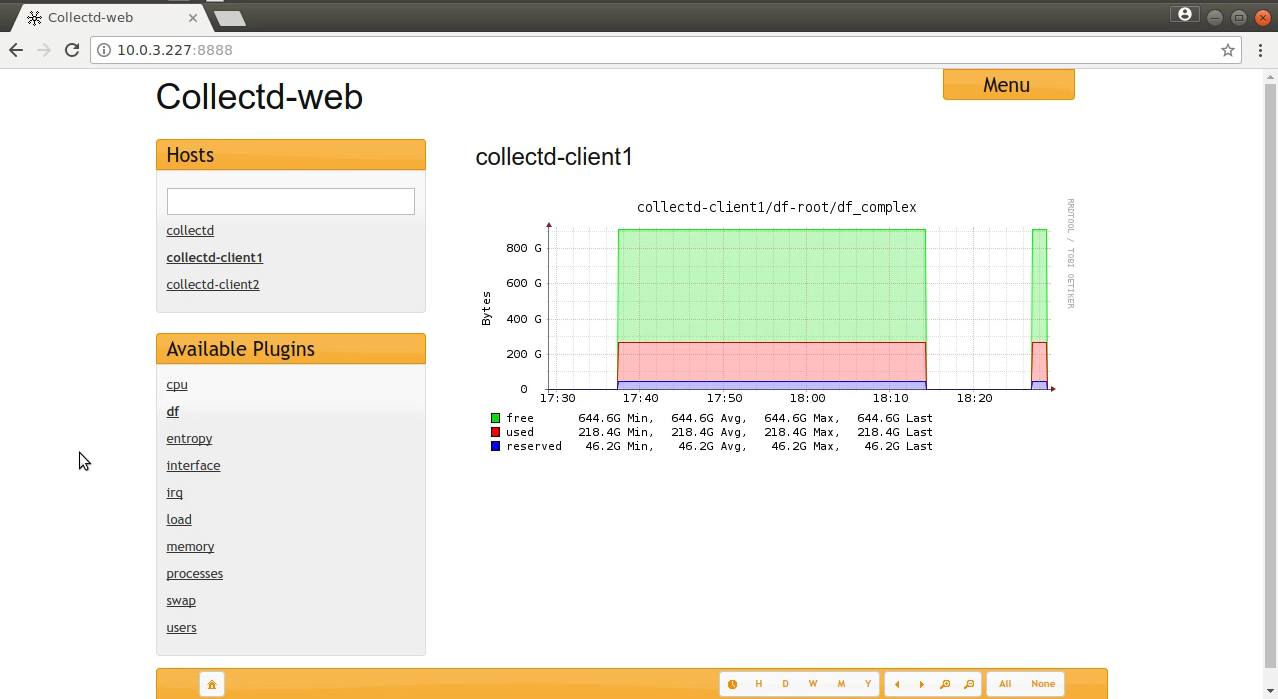
You might possibly require a server reboot and some luck to make this work the first time. It can be a bit finicky. But you’ll definitely appreciate the results.
Interpreting and acting on the results you get is your department, but myPluralsight Linux Performance Monitoring and Tuning course touches on a lot of what you’ll need to know. Interested in Linux administration in general? There’s lots more where that came from at my Bootstrap IT site, including links to my Manning book, Linux in Action, and a hybrid course called Linux in Motion that’s made up of more than two hours of video and around 40% of the text of Linux in Action.