A long, long time ago – back in late November, 2021 to be precise – I wrote “A Data Analysis of IT Career Training Tool Efficacy” to help with the difficult task of making smart career education choices. Believe it or not, there have already been some important updates.
That article began by introducing some powerful data tools for assessing the likely economic consequences of enrolling in individual US colleges. Those tools are designed to give us insights into completion and loan default rates, and which programs are the most likely to lead to financial success – or at least to eventually deliver enough employment income to cover your tuition. Spoiler alert: not all will get you there.
Nothing much has changed in that department, so there’s nothing more for me to say on that topic.
But the second half of the article focused on analyzing data from the 2018 freeCodeCamp New Coder Survey. That survey allowed us to explore some of the real-world costs and benefits of enrolling in coding bootcamps, online learning resources and, of course, freeCodeCamp.
In particular, we looked at the income and outstanding student debt reported by many of the 30,000 people who responded to the survey. Do expensive bootcamps translate to larger salaries? How about for-profit online training platforms? Do college degrees guarantee higher income?
The 2021 freeCodeCamp New Coder Survey
Since then, however, the results of the 2021 version of the survey came out. The new questions didn’t all follow exactly the same formatting they used in 2018.
For instance, respondents weren’t broken down by country, but by region. Therefore, instead of looking at just US learners, we’ll work with all North America. And income was reported as brackets (i.e., $40,000 to $49,999) rather than actual numbers. To make things easier, I converted the brackets to an average (meaning, “$40,000 to $49,999” became $45,000) so they’ll be approximations.
As before, the numbers from the survey are just numbers. Just because the average freeCodeCamp learner experienced greater or less success with a particular resource doesn’t mean that everyone will. And just because the average college graduate in the survey is stuck with a significant amount of student debt – 59% of his or her annual income, in fact – doesn’t mean that that’s what you’ll face.
And, of course, correlation is not the same as causation. Just because consumers of one resource earn more income than consumers of another, doesn’t mean it was the resource that made the difference. There may be important factors we’re simply not taking into account.
Still, these numbers can be really useful, and we’d be foolish to ignore them as we make our plans.
Bootcamps vs Online Learning Platforms
According to our analysis of the 2018 survey, in-person bootcamps underperformed, online learning tools like Pluralsight and Coursera proved much more cost-effective, and freeCodeCamp – naturally – provided fantastic value. Has that changed? Was Pluralsight’s incredible 2018 result (the income for the average Pluralsight learner was $52,895 – around 10% more than BA graduates) just a fluke?
Here’s how all that now looks using the 2021 survey data: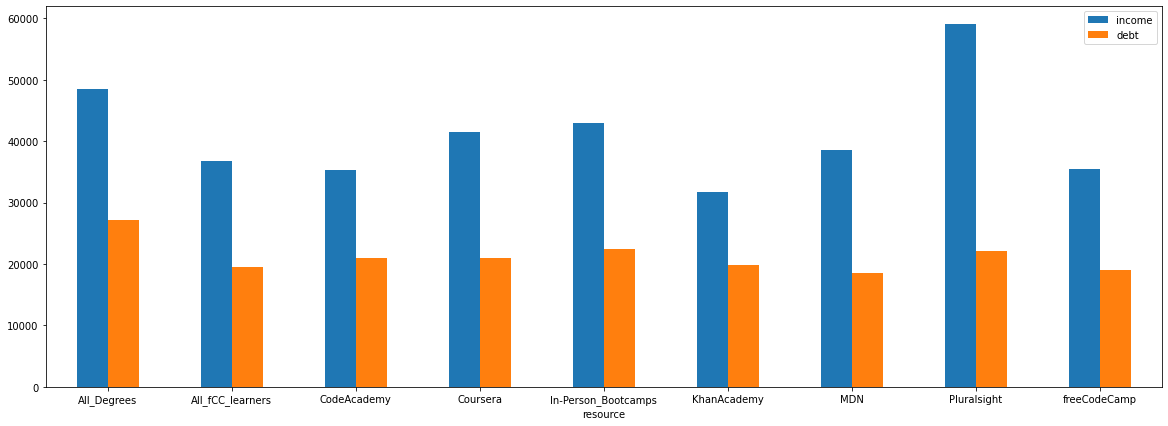
As you can see, the blue bars represent income from a particular resource, while orange shows us debt. Fortunately, the average user of all the included resources earns more in a year than their average debt.
Students of all in-person bootcamps reported a level of student debt-load ($22,476) that was second only to college graduates (“All_Degrees”). Their income, however, wasn’t even close to that of college grads ($41,972 vs $48,576). Does that qualify as “under performing”? I can’t say.
You can easily see that the highest student loan debt is for graduates of all degree programs. Considering the cost of college tuition and living expenses, that’s just what we’d expect. Equally predictably, we’ve already seen how income for college grads is also higher.
As I disclosed in the previous article, I produce courses for Pluralsight, so I have a bit of a personal interest here. I’ll therefore forgive you for scoffing when I tell you just how effective I believe that their course library is.
But that old result was clearly no fluke. The average Pluralsight learner now earns more than $59,000 a year – a 9% increase over 2018 – and carries only $22,180 of student debt.
Displaying Income and Debt Outcomes by Education
Getting a good sense of the income experiences of our freeCodeCamp respondents can be tricky. It turns out that there are some outliers, meaning a few people in each category who earn a lot more (or have a lot more debt) than most of their peers.
I could manually remove most or all of the outliers and concentrate on the main body of results, but that risks artificially skewing the remaining data. And it also involves way too much work for my taste.
So instead, I’ll visualize the data using box plots. The advantage of a box plot is that outliers remain visible, but the fact that they’re represented by dots far above or below the mainstream “boxes” means that their relationship to the rest of the data is obvious.
In the above plot showing income by educational level, the median income is represented by the line in the middle of a box, the box itself encompasses the middle 50% of the data set, and the “whiskers” are the minimum and maximum values not including the outliers.
As you can see, individuals with professional degrees and Ph.Ds earn the greatest incomes, while those without high school diplomas or trade certificates earn the least. No surprises there.
Let’s use the same box plot method to view student debt-loads:
Again, nothing shocking. College graduates hold the most student debt.
That single outlier with a high school diploma and $600,000 of student debt is interesting. I suspect someone clicked the wrong option at some point. Which proves just how useful box plots can be for this kind of visualization.
The fact that, on the whole, those income/debt results we’re getting are fairly predictable confirms that the survey has given us pretty good data. Which should make our earlier insights at least a bit more reliable.
Feel free to check out the original Python code used to generate these insights and visualizations.