How you train for your career is one of the most consequential decisions you’ll ever make. But it’s hard to narrow down your options for a career in software development or IT.
Medicine is easy: pick a medical school and apply.
But programming?
- Will what you learn in a four year computer science degree be outdated by the time you graduate?
- Does one college deliver better results than another?
- Do intensive (and expensive) bootcamps really work?
- Is it possible to learn everything you’ll need on your own using free online resources?
Program costs can range from free to many hundreds of thousands of dollars. And they can get you in and out in a few months, or drag on for a decade or longer.
At the same time, the payout in terms of your lifetime income will also vary widely.
It’s not enough to just go with what all your friends are doing or what “everyone says” is good enough. You’re going to need some data.
In this analysis, I’m going to introduce you to a couple of super useful data tools that are designed to help you assess both individual institutions and broad vocational training categories.
The first is the US government’s Postsecondary Value Commission’s data tool. You can download the complete dataset as a CSV from this page. And the second dataset comes from freeCodeCamp’s very own 2018 Developer’s Survey – whose data is publicly available.
Unfortunately, for purely practical reasons, the data I used for this article is all US-based. I know that many of you don’t live and work in the US. (I’m a Canadian myself.) But those were my constraints.
Nevertheless, most of the basic principles we’ll discuss here are universal. And your own country probably has its own set of similar resources that can bring you up to speed with whatever is unique to your part of the world.
You can find nearly all the tools I used in the analysis in the curriculum of my Teach Yourself Data Analytics in 30 Days curriculum. So there’s that.
I should note that all the insights you’ll see here are based on numbers, and incomplete numbers at that. The insights are interesting and, I believe, helpful. But they’re not guaranteed to be objectively correct. Data analytics has its limits. Its goal is to faithfully represent the real world, but numbers can be tricky.
The Postsecondary Value Commission
There are, from the rich store of publicly available data on the PostSecondary Value website, three metrics that interest us:
- The T-Zero (T0) threshold
- Completion rates
- Loan default rates
Together these can give us a pretty good idea of what kind of results you can expect from four-year colleges in general, and from individual institutions.
The T0 is designed to describe the real cost of a bachelors degree. That is, the estimated net cumulative cost of tuition and other related expenses in addition to the opportunity costs of not working full time during your student years.
They do that using the median earnings for high school graduates in a college’s home state. In other words, the income you could have expected to earn had you not gone to college.
How to Calculate T-Zero (T0) threshold
To illustrate, let’s say that the cumulative total cost of a four year bachelors program is $200,000, but the average student can expect to receive Pell grants and scholarships of $80,000.
Therefore, the cumulative net total cost of the degree is $120,000. To get the T0, this number is amortized (spread) over ten years, giving us a yearly value of $12,000.
We then add the median yearly earnings for high school graduates in that state – let’s say that’s $30,000. Well, $12,000 + $30,000 gives us a yearly T0 value of $42,000.
For your college investment to be worthwhile, you should expect to be earning at least in excess of $42,000 by ten years after you begin your studies. If a large number of a college’s students are earning significantly less than the T0, then you should be concerned about the quality and value of their programs.
What is Degree Completion Rate?
Degree Completion Rate is the percentage of students who enroll in a college and go on to graduate with a bachelors degree within 150% of the “expected time to completion”.
For a school where it’s expected for a bachelors to be earned within four years, 150% would be six years. Completion rates do not take into account students who transfer out and graduate at different institutions.
A school where 80% of its students graduate is probably on the right track. But a college with a 20% completion rate is definitely doing something wrong.
What is Loan Default Rate?
The Loan Default Rate is the percentage of a school’s students who eventually fail to keep up with their student loan repayments. A school with a high default rate among its students is probably not doing enough to ensure their financial success.
Interestingly, I found a clear correlation between program cost and completion rates, and between program cost and loan default rates. But it wasn’t the correlation I’d expected.
Take a look at this scatter plot where the x-axis represents the average cumulative net price of collages and the y-axis represents completion rates. The OLS trendline is clearly rising along with costs. Meaning that the higher the cost, the more likely students will see it through.

Similarly, this next plot shows that student loan default rates go down as program costs rise:

I guess we can say that the higher the stakes, the more seriously people take the challenge.
How to Know Whether a School is Good
Before looking at any one school, you really need a sense of how the entire industry is doing. The median earnings relative to T0 across all 5,877 colleges being measured is $13,909.
That means that, among students who attended all US colleges in the system, half are earning $13,909 more than their T0 thresholds.
At the same time, 75% of students are earning less than $22,595 above the T0.
(Note that these numbers aren’t quite accurate – they’re actually averages derived from individual median values – but they’re close enough.)
The average completion rate across all 5,877 colleges is 54.8%. That means that just over 45% of all students who enroll at US colleges fail to graduate. That’s actually a stunning figure. It suggests that a very large proportion of all students give up (or fail to finish for some reason) without earning their degrees.
But what about the tens of thousands of dollars and years of work? All gone. In fact, 11% of students in the average US college end up defaulting on their education loans.
What’s going on here? On the one hand, many schools seem to accept students who are unprepared for the challenge of college. Colleges do, after all, earn a lot of money for each new enrollment. In other cases the schools might simply have failed to properly teach their students.
Just imagine if you ran a business that charged many thousands of dollars for a product that broke down 45% of the time and drove 11% of your customers into financial insolvency. Do you think you’d be running that business for very long?
The data explorer lets you search for any college in the system. Check out schools in your area and pay particular attention to the relationship between the median income (a number representing the income actual students of that school are earning ten years after initial enrollment) and the T0.
If the T0 is higher, it means that most students are actually losing money on their education.
The 2018 freeCodeCamp New Coder Survey
Even though it’s still an excellent representation of the state of the industry, this three year old data isn’t getting any younger. So let’s get started.
First, a few general observations. The 1,643 US-based freeCodeCamp respondents who reported having outstanding student debt held an average $36,171 of it. That’s very close to the latest (November, 2021) national figure of $39,351 reported by Education Data. I think this suggests that the freeCodeCamp data is largely representative of real world conditions.
How Much Do College Graduates Earn?
What do those students get in exchange for their investment? The average annual income of all 3,645 US-based respondents who reported earnings was $41,874.
The 137 of those who had trade, technical, or vocational training earned a bit less: $39,897.
The 1,399 with a bachelors degree (in any field) earned $45,818.
And the 139 who had achieved a professional degree (MBA, MD, JD, etc.) averaged $71,151.
Running up $36k of student debt can make sense if there’s a very strong chance the program you’re taking will return income at a level that will eventually cover and surpass all of your costs. If your own research doesn’t leave you so confident on that score, then you should explore cheaper alternatives.
Are Coding Bootcamps Worth it?
When it comes to coding, one of those cheaper alternatives is one of the many intensive bootcamps that have appeared in recent years.
Bootcamp course lengths tend to be measured in months rather than years, so they obviously require a smaller investment. But they’re not exactly cheap. Tuition for many bootcamps will cost $10,000 or more and, since they’re generally full time. You’ll need money for food and housing while you’re enrolled.
Does the bootcamp experience translate to higher income? The 3,411 US-based survey respondents who had never attended a bootcamp and reported their previous year’s income, earned an average of $42,018.
Surprisingly, the 234 respondents who had attended a bootcamp reported earning only $39,771. In addition, 102 of those bootcamp students who also had never attended college nevertheless reported an average of $22,941 in student debt.
Now I won’t claim that this figure is a true and absolute representation of the entire bootcamp world. There are certainly many individuals for whom bootcamps work wonderfully. But 234 is not an insignificant number. This is something to keep in mind.
freeCodeCamp, on the other hand, is designed with busy adult learners in mind. As such, the learning resources require learners to do more of the legwork than traditional schools would.
The curriculum is made up of comprehensive video and text content, interactive coding environments, and projects and challenges. And campers can find support among study groups around the world.
freeCodeCamp even offers extensive job interview preparation. And, of course, it’s all available in the comfort of your home and for free.
Besides bootcamps, however, there’s another category of technology learning resource: online courseware.
Do Online Courses Work? Insights from Data Analysis
Some online learning resources (like Khan Academy and, of course, freeCodeCamp) are available for free.
Others, like the four year college-affiliated Coursera or edX, charge for making certificates available at the end of their courses, but their content can usually be accessed for free.
And the content provided by platforms like Pluralsight can be accessed through monthly subscriptions. The costs of all of these options are significantly less expensive than either colleges or bootcamps.
So how do these resources compare to colleges and bootcamps when it comes to increased income? The chart below lays out some of the numbers from the freeCodeCamp survey.
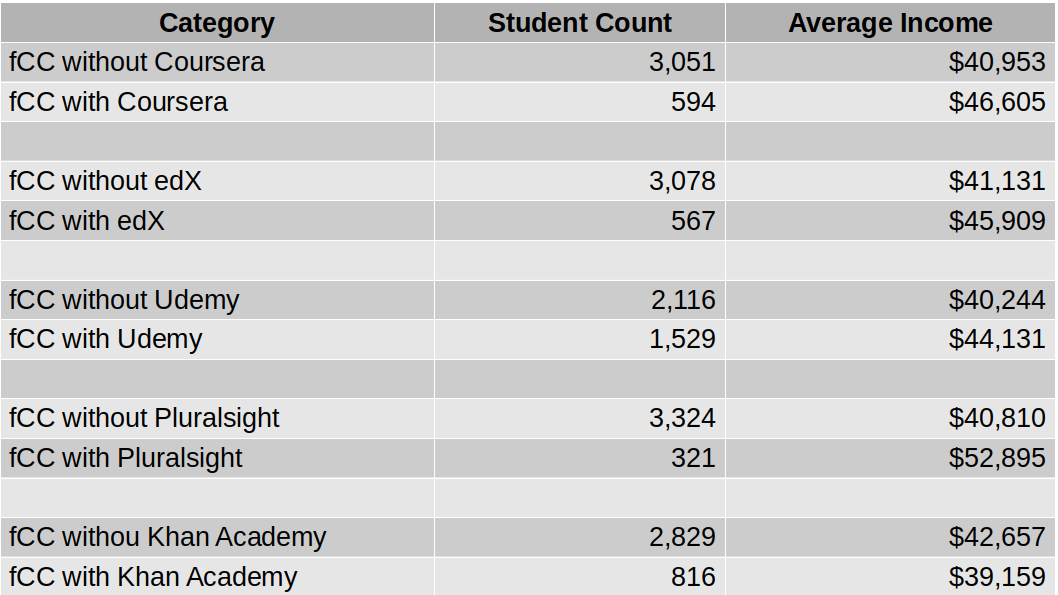
As you can see, income increased by around $6k for the 594 students who added Coursera content to their education portfolio. 567 edX students enjoyed nearly $5k extra income. The 1,529 freeCodeCamp students who also used Udemy saw nearly $4k extra. Inexplicably, you stood to lose $3.5k for using Khan Academy resources.
But what about those Pluralsight numbers? Now, I should come clean and confess that I’m a content author for Pluralsight, so I have a horse in this race. But there’s no missing the fact that Pluralsight delivered an average income premium of $12k over users accessing only freeCodeCamp. That’s a whopping 24% bump.
Again, all of those numbers are just statistical assumptions. They’re not hard, reliable predictions of what you’ll actually experience, and they won’t apply equally to everyone.
But they are tools that can help you think more productively about how you should be planning your education. Use them to give some thought to your plans and hopes within the context of what may be affordable now…and in ten years. But also try to go past the recruitment hype to see the true underlying value.
Now it’s your turn.